Here's the question I set out to answer: for a factory that runs around the clock and buys electricity at the prevailing wholesale price (no fixed deal), what is its price exposure for a single delivery day?
The answer I landed on, for a Tuesday in June 2026: a base case of ~10.8 p/kWh for a flat 24/7 load, with a range of ~10.2 to 10.8 p/kWh depending on the load profile. And — the part I care about most — it matched the day's realised traded price to within 0.5%.
The hard part was scoping, not maths
An electricity bill has several parts: the wholesale energy, network charges, policy levies, and supplier margin. Most of those are largely fixed and known in advance. Only one is genuinely set by the market on the day — the wholesale price. So that's the part that's actually "exposed," and that's what I estimated. Quoting a big all-in number would have been easy and wrong; the question was about exposure, and only the wholesale bit is exposed.
Second decision: this is something I can read, not something I have to forecast. The GB day-ahead auction publishes each day's hourly prices the afternoon before delivery — for the 16th, it cleared at 09:57 the day before. So I'm reading a settled, money-backed market price, not predicting one. Exposure for the day is then just the consumption-weighted average of those hourly prices.
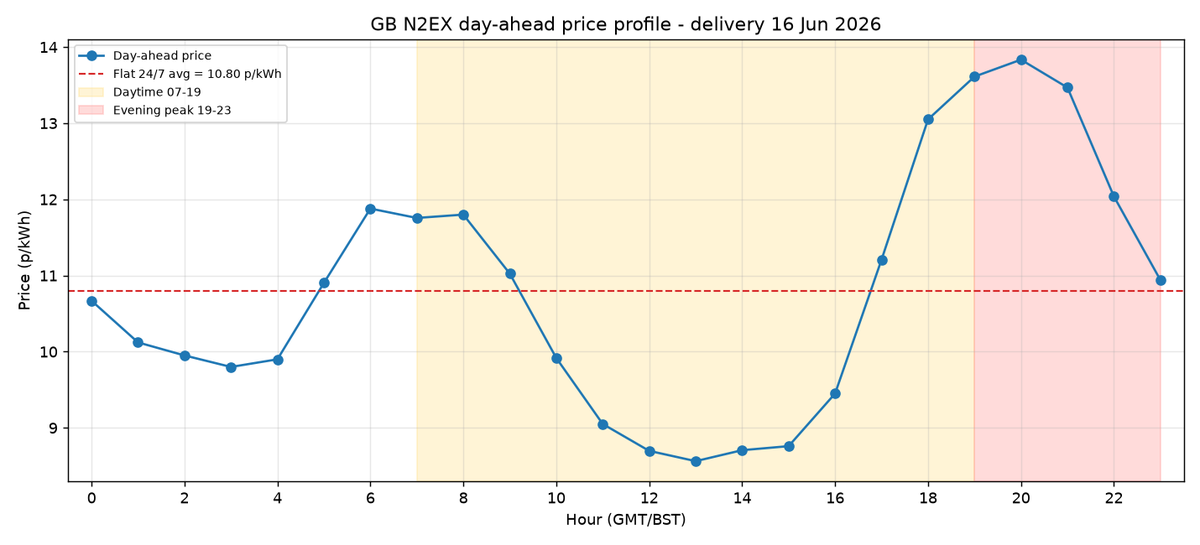
The load profile is the biggest source of uncertainty, and I didn't have it — so I carried it as an explicit assumption and reported a range across plausible profiles, rather than hiding a guess inside a single number. A flat 24/7 load is the top of the range; daytime- or overnight-weighted loads are cheaper, because they miss or partly miss the evening peak.
Free data only — and a validation step
The actual auction price is free to view but its API is paid, so I read the published cleared prices directly. The one free machine-readable GB series is Elexon's Market Index Data — the volume-weighted price of trades actually done in each half-hour. It isn't a day-ahead price and isn't published in advance, which makes it perfect for one thing: checking my estimate after the fact against what really traded.
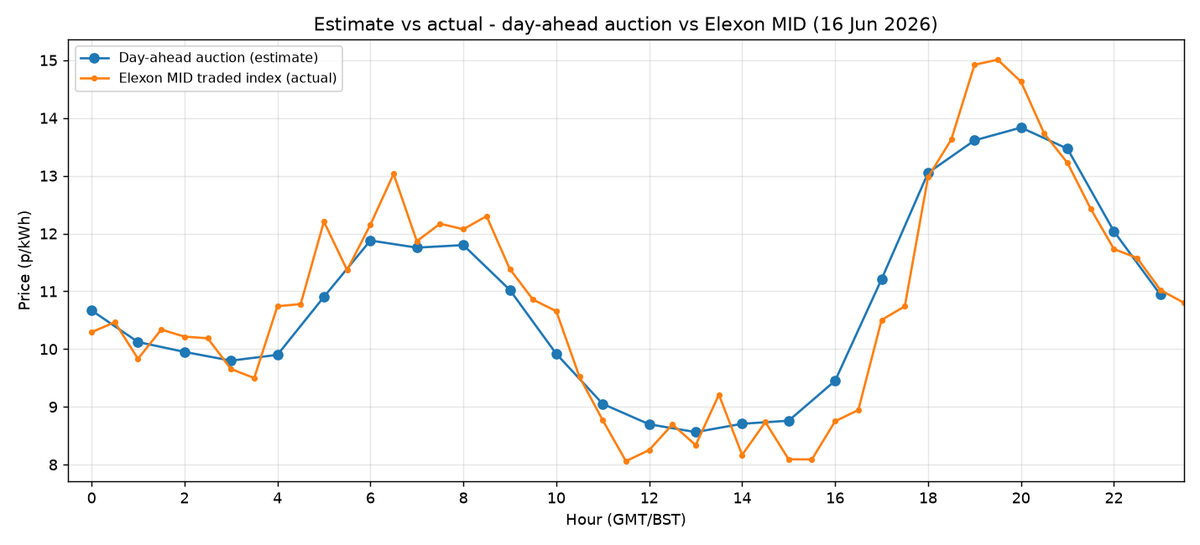
The two lines track closely all day. The daily average gap was +0.5%. That's the difference between "here's a number" and "here's a number, and here's the evidence it was right."
Why the level is what it is
On a weekday like this, gas plants are usually on the margin — they're the last unit dispatched, so they set the price. That's why the level sits where it does and why the evening peak is pronounced. It's worth saying out loud in the writeup, because a number with no explanation is hard to trust.
The transferable bit
Most of the value in a data task like this isn't the calculation — it's the scoping ("what is genuinely the exposed quantity?"), the honesty about the biggest uncertainty (the load profile, carried as a range), and validating the answer against ground truth. Those three habits travel to almost any estimation problem.
If you've got a measurement or estimation problem like this — where the answer needs to be defensible, not just plausible — that's the kind of work I do at twentytwotensors. Get in touch.